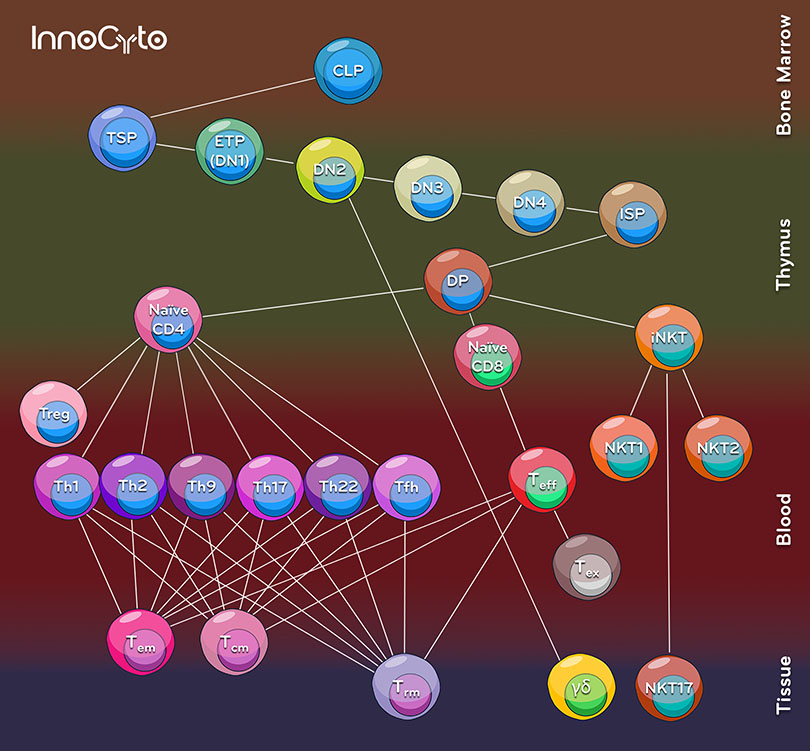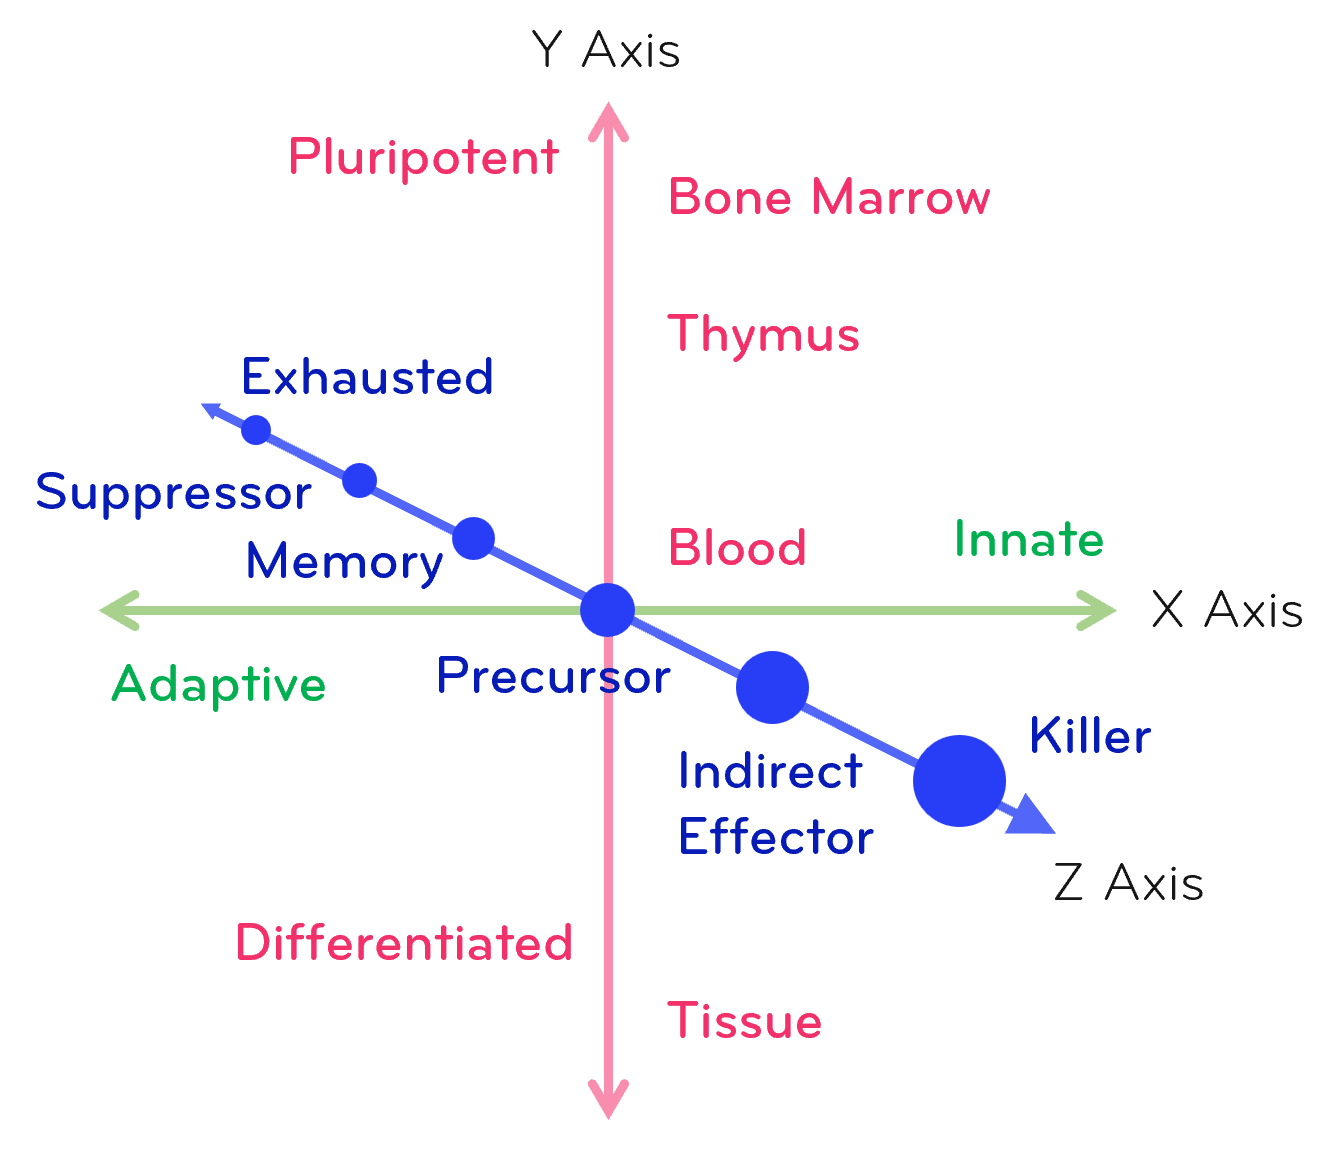
The T cell lineage map depicts the progression of T cells from early lymphoid progenitors in the bone marrow through staged development in the thymus, beginning with double-negative (DN) populations, transitioning through immature and double-positive (DP) thymocytes, and ultimately differentiating into single-positive CD4+ or CD8+ naïve T cells. From these naïve states, the map outlines diversification into multiple functional subsets, including CD4+ helper lineages (such as Th1, Th2, Th17, Tfh, and Treg), cytotoxic CD8+ effector and exhausted cells, as well as innate-like populations like γδ T cells and invariant NKT cells. It also highlights the formation of memory compartments—central memory, effector memory, and tissue-resident memory T cells—emphasizing both developmental checkpoints and the functional specialization of T cells across lymphoid organs, circulation, and peripheral tissues.